
Metrics and Reports by SolveroX
One-click tables and dashboards for Jira-powered service delivery.
Metrics and Reports by SolveroX delivers the essential Jira Service Management (JSM) metrics you need to monitor and improve your support performance in one click. It automatically pulls all required data directly from Jira Service Management and generates clear, actionable reports on response times, resolution times, SLA compliance, and customer satisfaction. Interactive tables and charts provide visibility into SLA success rates, CSAT scores, status distribution, and resolution breakdowns - giving you the insights needed to make informed, strategic decisions.
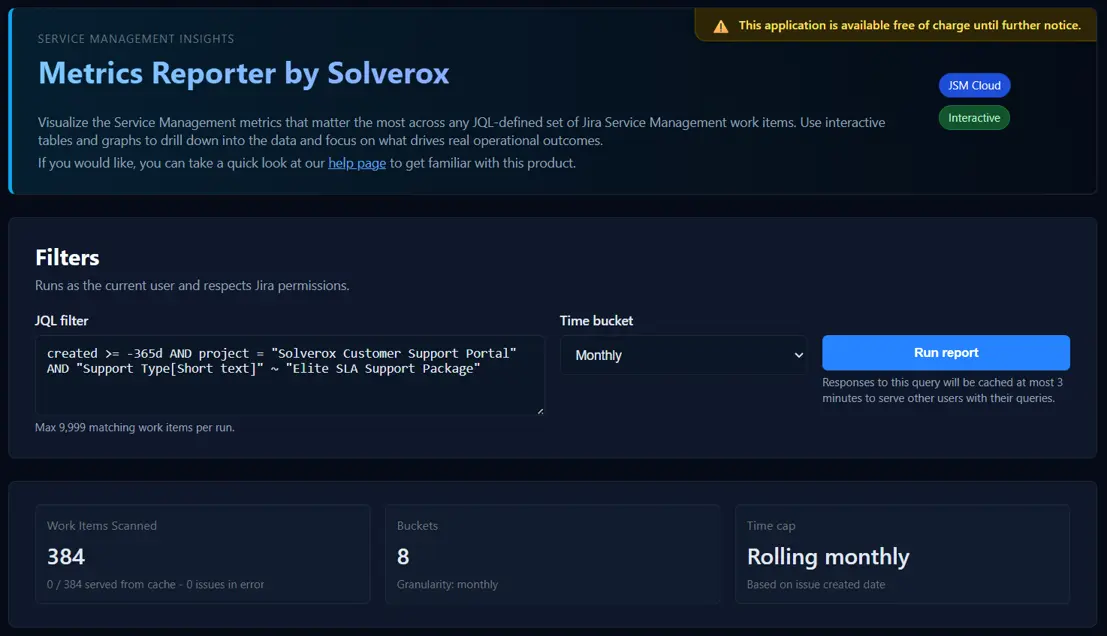
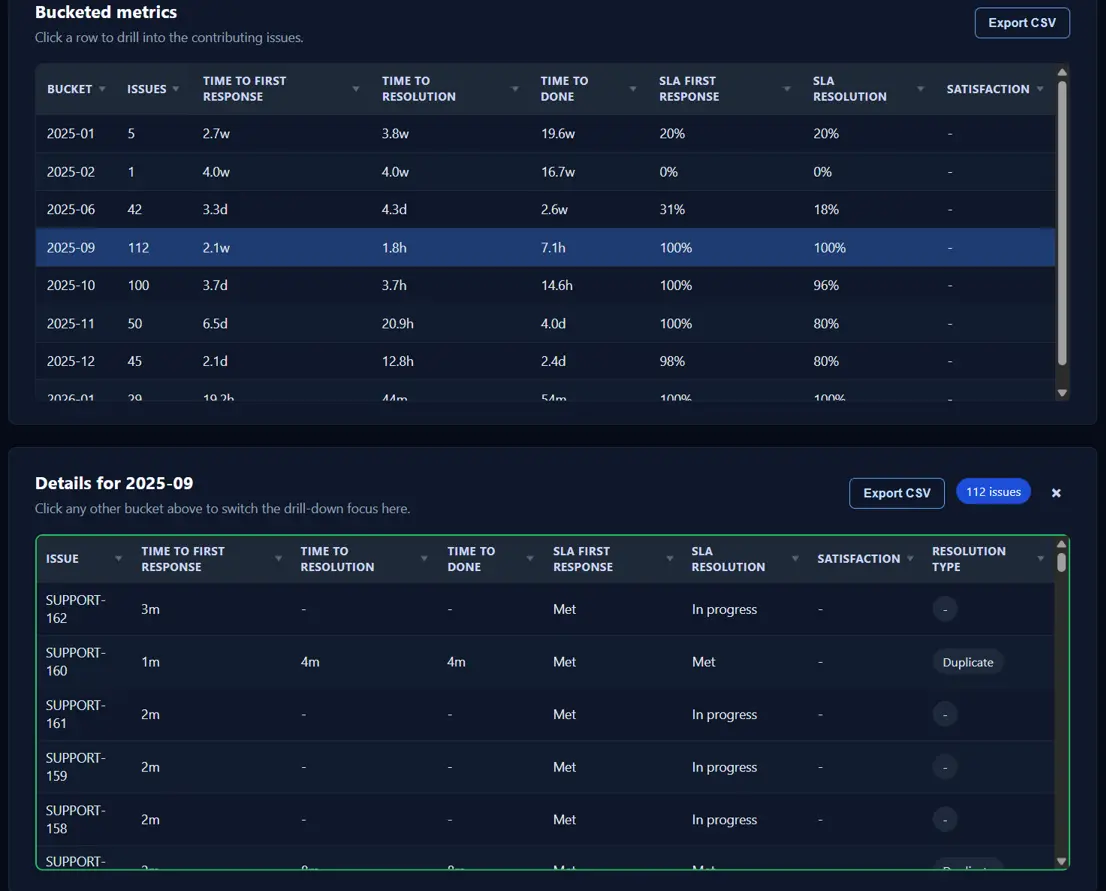
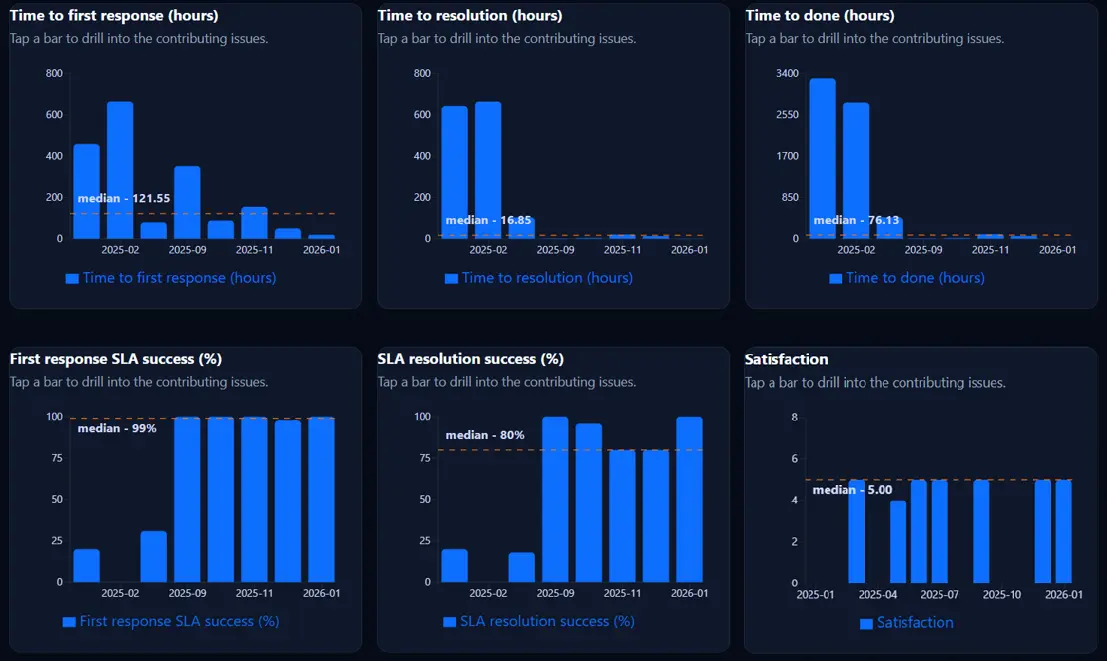
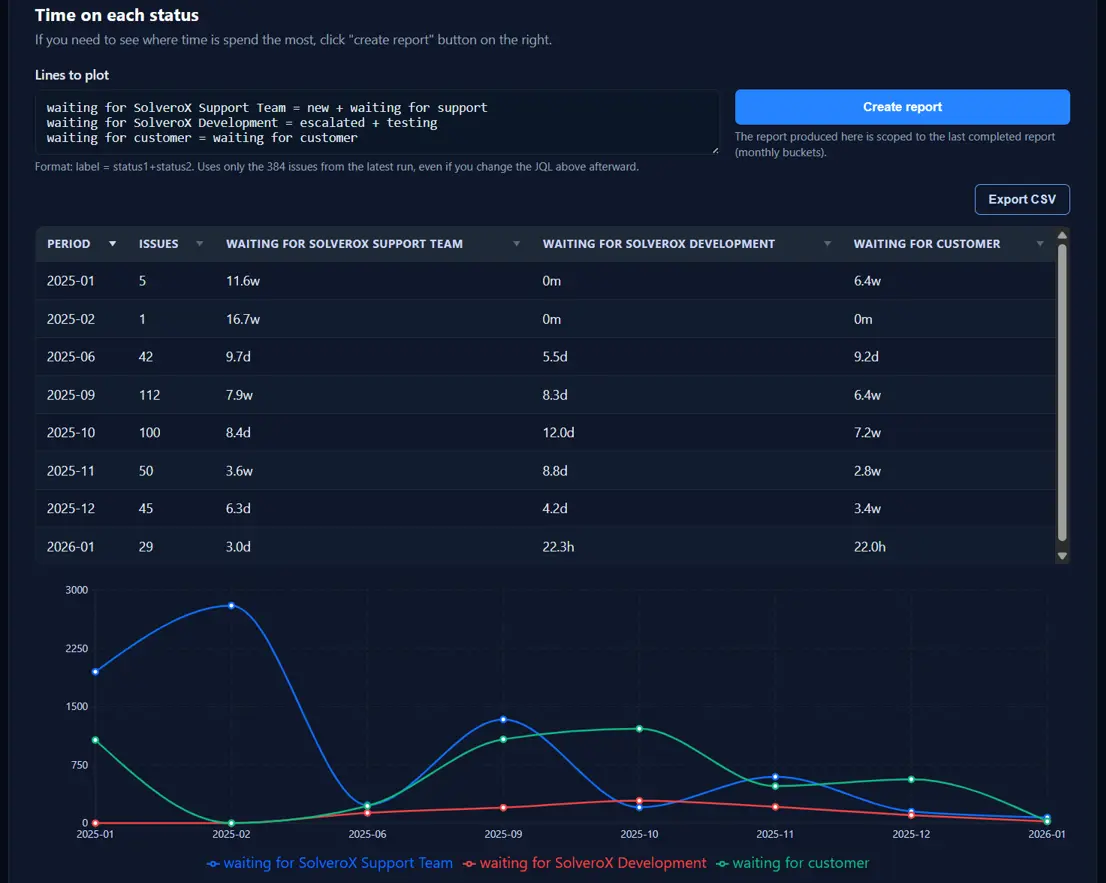
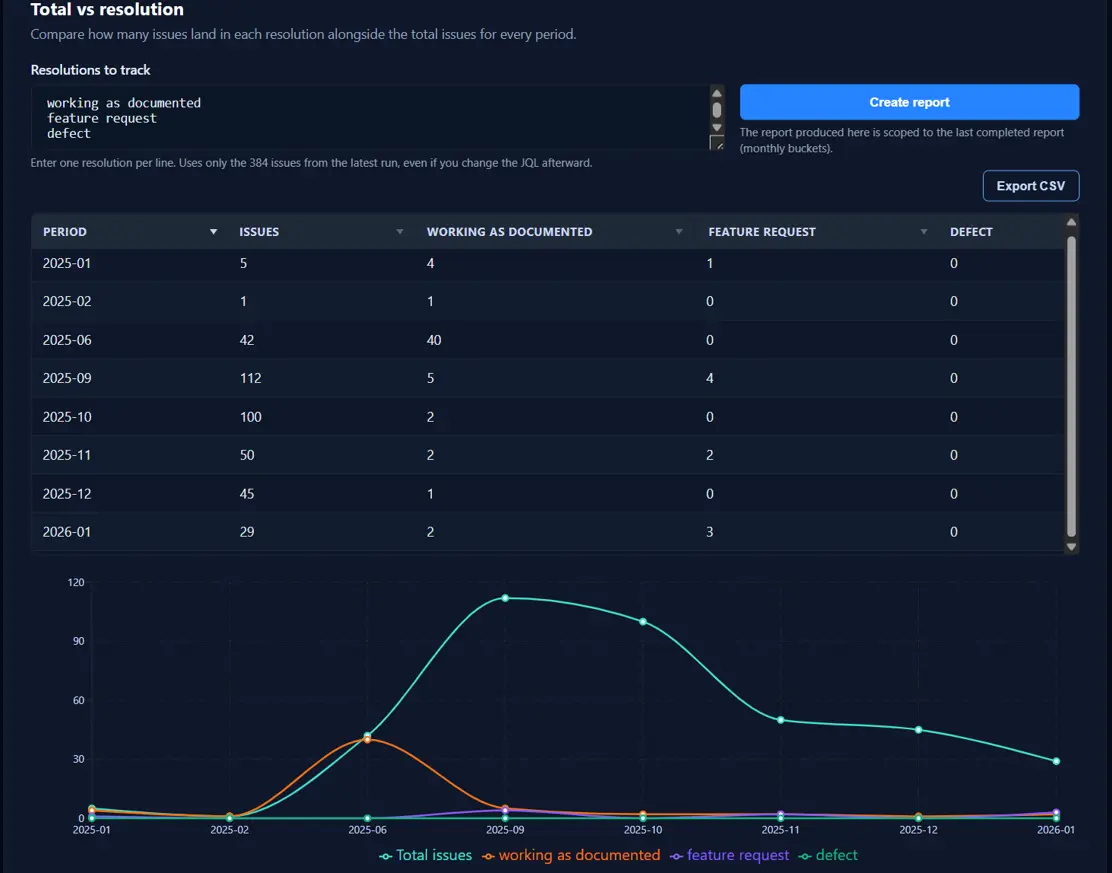
Visualize your service delivery in seconds:
- Key metrics to assess your service delivery
- Clear and easily interpretable information for your stakeholders
- SLA compliance
- Interactive dashboards and export features
What does this application do?
Get all the JSM reports and metrics that matter the most across any part of your support delivery with one click - whether by specific customer, SLA support package, geography, priority level, or support provided by selected team members or teams. Steer your support delivery & strategy according to the insights to the right direction.
- Time to First Response & its SLA success rate
- Time to Resolution & its SLA success rate
- Time to Done & its SLA success rate
- Tickets by priority
- Ticket re-open rate
- Customer Satisfaction ratings
- Tickets by request type
- Time spent on each status for your Jira work items
- How you close (resolution types) your Jira work items
- Report on any custom fields to see the work item distributions, such as by geography, support package type, account managers, etc.
How does it work?
You only specify the Jira work items you want to get a report for. You write any JQL that Atlassian permits, and you get all the reports, metrics, tables and graphs for the matching JQL set. You can get reports for specific customers, geographies, support packages, team members, time periods, etc.
Metrics and Reports application automatically captures all the relevant data to produce the tables and graphs you can rely on. All the tables and graphs are interactive. All timers respect your SLA calendars, pausing exactly how your SLAs are defined.
You have the luxury to export the data and create any graph you want, but why would you do that when there are already perfectly crafted graphs ready to consume?
See exactly where work items wait and which teams own the time, so you can adjust staffing or processes immediately. Simply provide free-style mathematical equations to specify which teams are using which statuses.
See how you close your Jira work items and compare it to the total incoming volume to get insights.
Report on any custom fields to see the work item distributions.
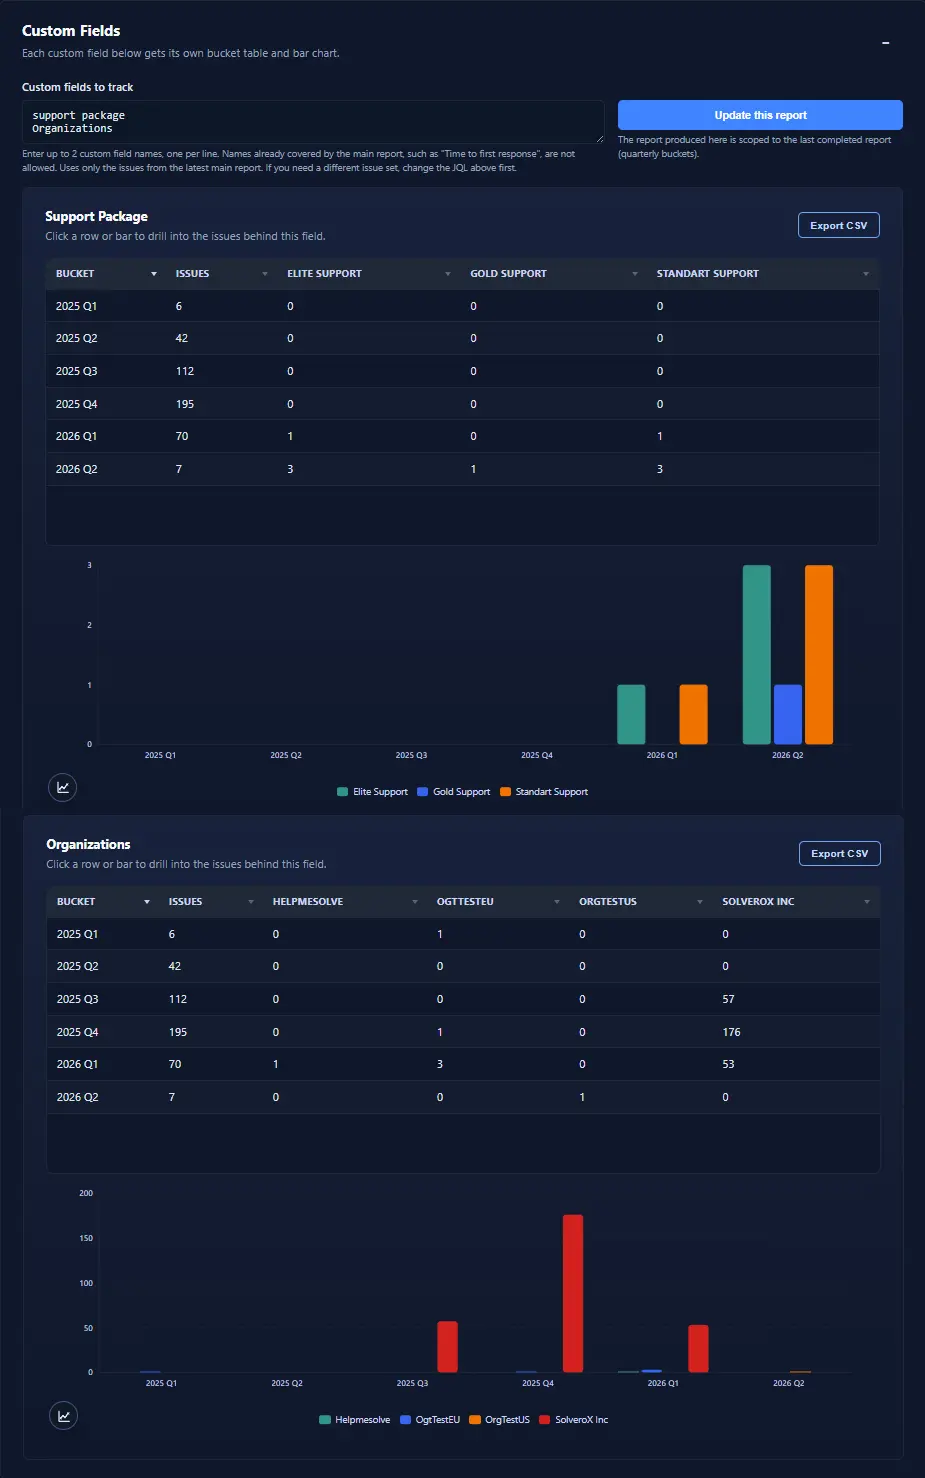
It really is one click: paste a JQL, pick your rolling period, and Metrics and Reports packages the rest. This application does not only provide you verifiable metrics but also ensures that whoever runs the report can see only what s/he is authorized to see.
Outcomes
The metrics reported with this application will provide end to end visibility for your Jira Service Management (JSM) and delivery quality.
Operational visibility
- Trustworthy SLA tracking for every customer or support tier
- Instant comparisons across regions, segments, or packages
- Proof to back every metric with one click into the source work items
Customer experience
- Know exactly where response or resolution delays happen
- Correlate satisfaction scores with SLA performance
- Share credible updates with leadership or customers immediately
FAQs
2-minute user video
Please see our video on Youtube: https://www.youtube.com/watch?v=J5zbuBdhIyU
Example JQLs to use
- How is our team doing overall since the beginning:
project = Helpdesk - How is our team doing overall regarding only the closed work items in our own Jira project:
project = Helpdesk AND status = Closed - How am I (or is Kevin) doing this year:
project = Helpdesk AND assignee = 557058:a311c218-80fc-4184-8cf2-d5ce9b847506 AND created >= -365d - How was our service to Acme Corp in months:
project = Helpdesk AND Organizations = "ACME Corp" AND created >= -365d - How is our service delivery for our customers with "Elite Support" Package:
project = Helpdesk AND "Support Type[Short text]" ~ "Elite SLA"
Note: If you write your JQL in Jira - Advanced JQL search bar, it helps you auto-complete your JQL.
Dont know how to write JQL: Consult with a well-known AI assistant and ask it to write it for you. Just make sure that you have project=your_project_name in your JQL to keep the report only for your project.
What is the easiest way to verify that this application provides perfectly correct metrics?
- Enter a JQL for a single Jira work item that you want to make the calculations detailly. Example:
key = SUPPORT-27876 - Fill in all the statuses one by one for the "Time on each status" report. Example:
c=waiting for customer
s=waiting for support
i=in progress
e=escalated
p=pending
collective=waiting for customer+waiting for support+in progress+escalated+pending - Do your calculations manually or share:
- screenshot of the entire work item history
- screenshot of your SLA definitions
- screenshot of the entire report we generated to your well-known AI, and ask it to calculate the results for you.
This will make you fully confident on how our calculations work flawlessly.
PS: Please familiarize yourself with two different methods of calculations and what they show. If you see any discrepancy, please share the relevant info with us and let's see together.
How can I see the details of the metrics or verify the metrics I see?
- Click on the table row to see the details to see which work items are in the tme bucket.
- Click on any graph bar or line point to see which work items are used to build that graph value.
What contributes to the calculations?
For all calculations, only the metrics that can be fetched are used.
For example, if a work item has first response time but it is not yet resolved, it only contributes to first response and first time SLA(if defined) metrics, but not to the resolution and resolution SLA metrics (and time to done as expected).
Or if the application is able to fetch only partial data for a jira work item, such as only "ticket priority", because of a transient error (also shown as xx issues in error on the UI), this ticket contributes only to the "tickets by priority" calculations.
What is the difference between Ticket Creation Date and Event Based in the Reports are based on selection?
This application provides 2 reporting methods:
- Ticket Creation Date: focuses on service quality from the customer's perspective. It groups results by when work items were created and answers the question:
"For the work that arrived during this period, how well did we perform?"
This view is useful for measuring customer experience and the outcomes delivered for a specific intake period.
When Jira SLA data is available, calculations use Jira SLA timers and calendars. For the time-based metrics, if SLA data is not available, the app can fall back to wall-clock calculations. This allows you to still analyze service speed even if SLAs are not configured in your Jira instance.
- Event Based: focuses on operational throughput from the team's perspective. It groups results by the relevant event date for each metric, such as an SLA stop date, resolutiondate, Satisfaction Date, or another metric-specific event date.
"During this period, what work was completed, and how did the team perform?"
For metrics that have a close Jira / JSM equivalent, this method is designed to follow Atlassian-style bucketing as closely as possible. For app-specific metrics, the logic remains specific to this application. Because of that, some reports can be compared closely with Atlassian's native reports or gadgets, while others should be understood as app-specific extensions.
A practical example:
If you resolve a 1-year-old ticket today, your internal teams may want to measure that result as part of today's operational output. That is the Event Based view.
At the same time, customers may want to know how well you handled the tickets that were created 1 year ago. That is the Ticket Creation Date view.
While "Ticket Creation Date" shows customer-cohort / service-quality view, "Event Based" shows event-date / operational-throughput view.
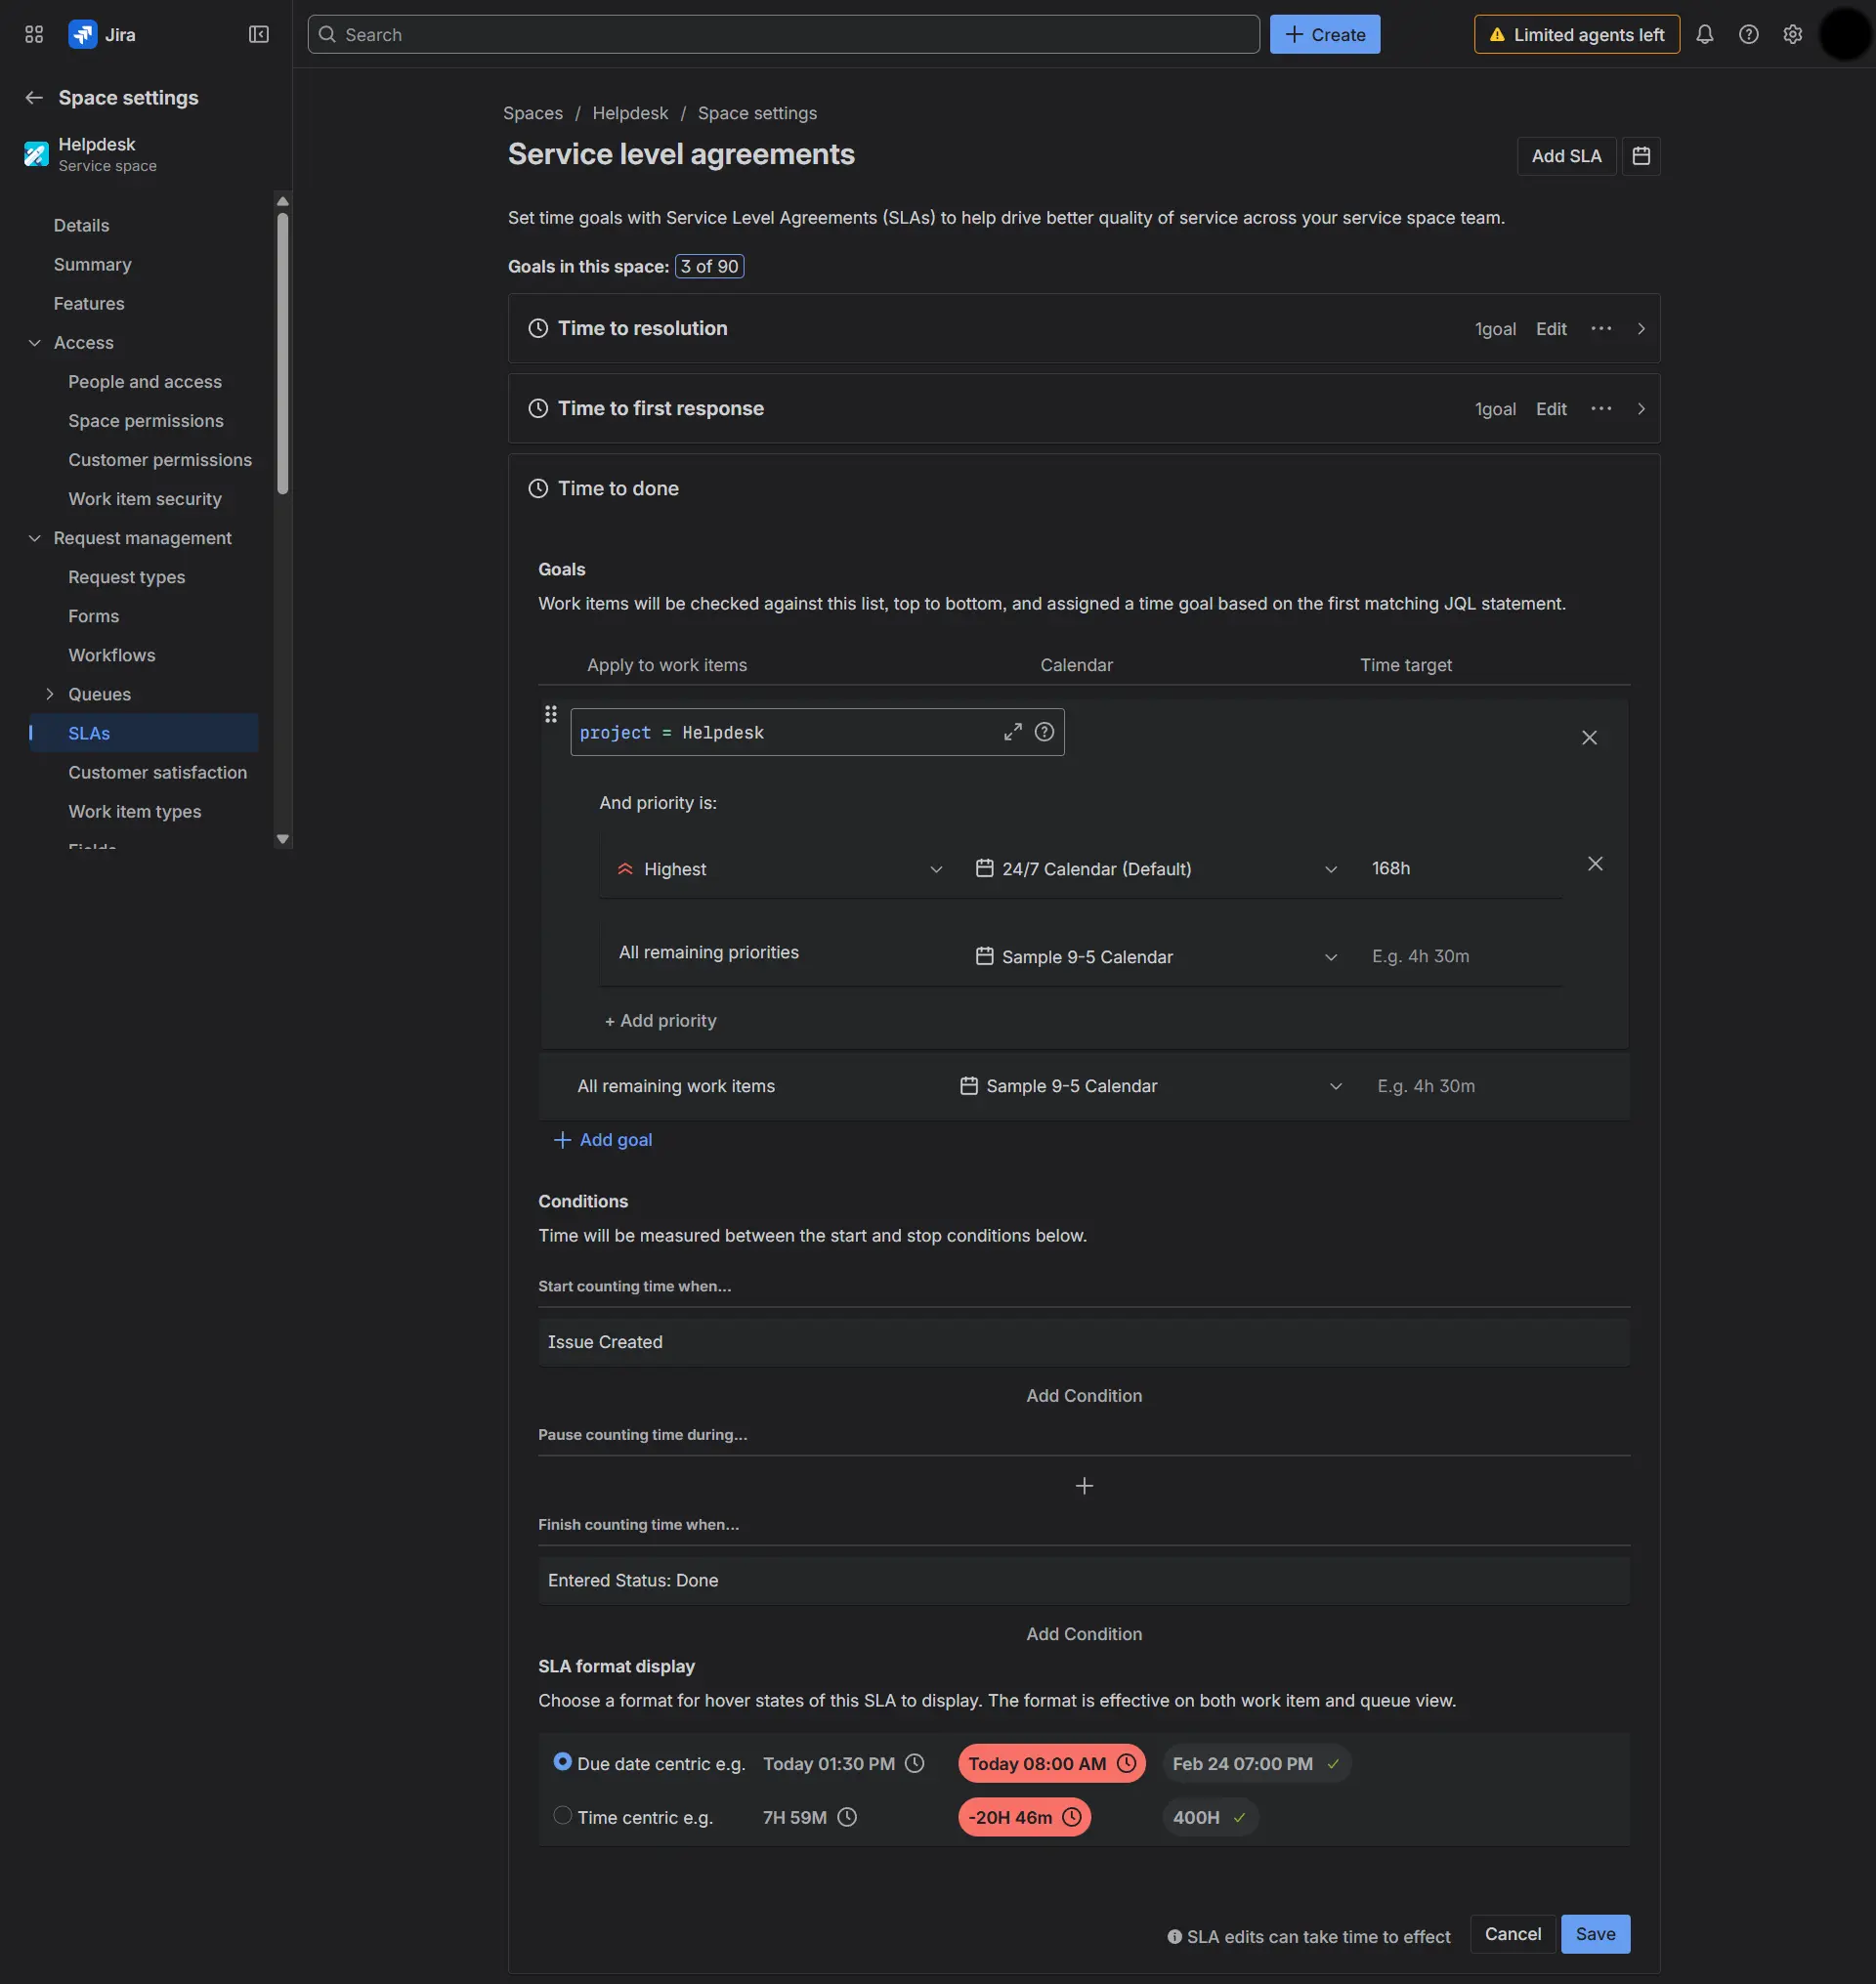
What is so special about "Time to done"? How to create "Time to Done SLA"?
When you create your Jira instance, by default, usually these three statuses are considered as "Done" in the workflow:
- Cancelled
- Resolved
- Closed
When you create your Jira instance, by default, usually only these 2 SLAs are defined:
- Time to First Response
- Time to Resolution
- If you do not define Time to Done SLA, your Time to Done metric will calculate the time between the work item creation and the latest status change to any of the "done" statuses using wall-clock.
- If you do define Time to Done SLA, your Time to Done metric will calculate the time between the work item creation and the latest status change to any of the "done" statuses respecting your Time to Done SLA timer.
If you are using your Jira instance with the defaults (there is Time to Resolution SLA; there is no Time to Done SLA; Cancelled, Resolved and Closed are all considered as done):
- "Time to resolution" respects the SLA calendar, thus the "Resolution SLA success" shows the success rate as expected.
- "Time to done" shows wall-clock timing for the same work item set, while "Time to Done SLA Success" will not show anything since there is no SLA defined.
To see how Time to Done SLA can be defined, please review the sample below.
What does ZZZ issues in error mean?
"Issues in error" are the work items for which we hit fetch failures even after we perform re-try operations. If you see a number of issues in error, please try running the report again and if it persists, please contact us at support [at] solverox [dot] com - your expectation should be to see 0 errors per reports.
Why do I see "0m" for some of my work items?
The most probable cause is that your SLA calendar does not count the time because the work items you investigate are outside of the SLA calendar they are tied to, thus the timer is not working (normal).
What is "Time on each status"? What are the best examples to utilize it?
Many organizations want to see the time spent on work items according to different departments, or their company vs their customers. Here, you can provide basic mathematical equations for your table/graph labels:
my bucket name that will show as graph label = Average of (status_1 + status_2 + ... + status_n)
Here are some examples to build your table/graphs (you can create up to 10 different labels):
- Waiting for Customer = waiting for customer -> shows how much (average) your work items wait for customers to come back to you.
- Waiting for Solverox Support = Waiting for support -> shows how much (average) your work items wait for your support team.
- Waiting for Solverox Development = Escalated + In Progress + pending -> shows how much (average) your development/test/product teams work.
Let's say we focus on two work items, SUPPORT-1 and SUPPORT-2. Let's assume SUPPORT-1 moved to "waiting for support" twice, and it stayed in this status first for 6 minutes and second for 4 minutes, so SUPPORT-1's "waiting for support" total is 10 minutes. SUPPORT-1 never moved to "pending". SUPPORT-2 moved to "waiting for support" only once (30 minutes) and to "pending" only once (20 minutes).
This is what we expect to see in the graph: SUPPORT-1 waiting for support = 6m + 4m = 10 minutes; 0 minutes for pending. SUPPORT-2 waiting for support = 30 minutes; 20 minutes for pending.
The average you would see for "waiting for support" = 10 minutes for SUPPORT-1 + 30 minutes for SUPPORT-2 = 40 minutes / 2 work items = 20 minutes.
The average for "pending" = 0 minutes for SUPPORT-1 + 20 minutes for SUPPORT-2 = 20 minutes / 2 work items = 10 minutes.
For "ticket creation date" method you see these times in the period the ticket is created. For the "Event Based" method you see these times in the period where the work item is resolved.
What is "Custom Fields"?
This report gives you the ability to see the distribution of up to 2 custom fields over the JQL period bucketed by ticket creation date. The most common custom fileds our customers use are:
- "SLA type" to report the service quality for different support packages
- "Account Managers" to report the service quality for the accounts of different Account Managers or Business Development Managers
- "Geographies" to report the service quality for the groups of customers in different Geographies
Note: For custom fields, we have a hard limit of 256 characters for the lenght of that custom field - this means that if you expect to have entries longer than 256 characters for your custom fields, you should expect your results to be truncated to the first 256 chars in the report output.
What do I see with "Ticket re-open rate"?
What you see is the percentage of the tickets that turned back to a "non-done" status after it reached one of the "done" statuses. This metric is always recorded in the period where the work item was created - regardless of reporting method.
Why should I keep the browser tab open and active during report generation?
Modern browsers and operating systems may reduce or pause background activity for tabs that are minimized, inactive, or running behind other applications. During report generation, the application maintains a continuous real-time connection with the processing service to receive live data and progress updates.
If the browser tab becomes inactive, the browser or operating system may throttle or suspend these background processes. This can interrupt communication with the server and may cause report generation to fail, stall, or display connection-related errors.
To ensure reliable report generation, keep the browser tab open, visible, and active until the report has been completed.
The time required to generate a report depends on several factors, including current Atlassian infrastructure load, the complexity and customization level of your Jira instance and the report itself being generated. Generation times may vary significantly between environments and report configurations.
If you cannot wait for a long-running report to complete, consider refining your JQL to reduce the matching number of work items included in the report. This can significantly reduce the report generation time and allow you to view the results sooner.
Note: You can safely browse this help page while your report is being generated. Feel free to use this time to familiarize yourself with this application.
Common error messages and their explanations
"The browser could not fetch the report data. Please run the report again."
The most possible reason is that the browser tab/window was not active during report generation. Please see Why should I keep the browser tab open and active during report generation? for more details.
"These statuses were not found in Jira:"
The most possible reason is that the statuses you want to report on are not available or you do not have permission to view them. Please check the workflow definition for your Jira project to see if the statuses provided exist. Also make sure that you do not use quotation marks or any other characters as this can cause the statuses to not be found. The format should match exactly the status names in Jira, including spaces and capitalization, as shown in the tooltip text just below the input field.
"These custom fields were not found in Jira:"
The most possible reason is that the custom fields you want to report on are not available or you do not have permission to view them. You can either check the Jira admin page to see if the custom fields exist, or export a sample issue as CSV and check whether the custom fields appear in the columns of that sample issue.
How can I update this application?
All the minor updates to this application are pushed automatically.
For the major updates to take effect, one of the Jira Admin users needs to update this application manually.
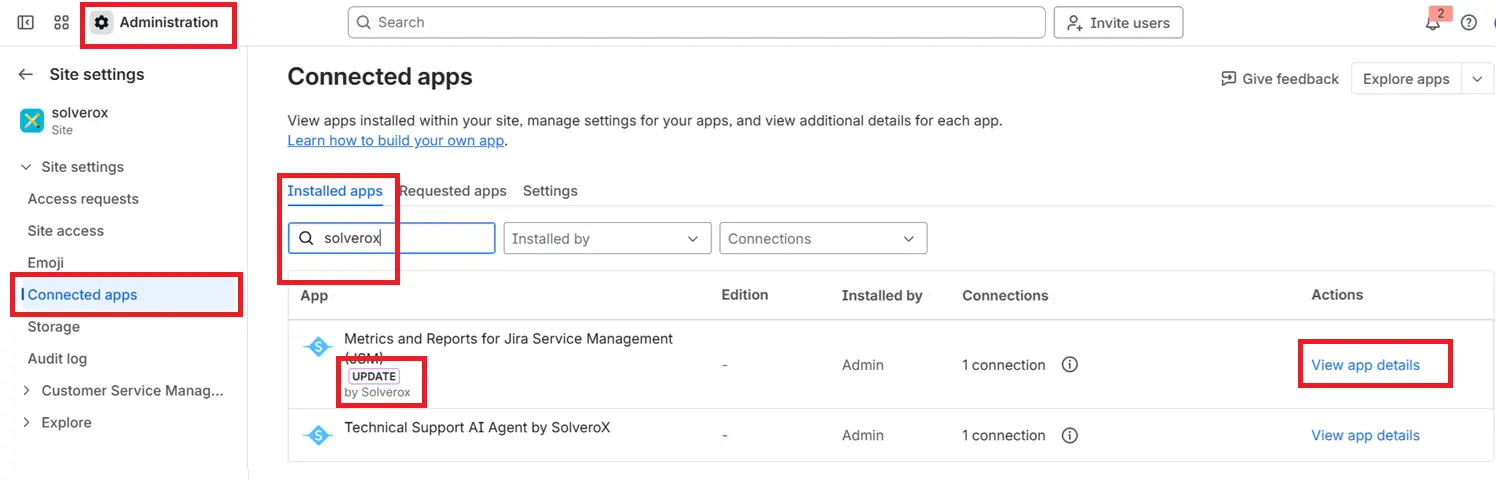
Please contact your Jira Admin, ask them to go to "Connected Apps", find "Metrics and Reports", click on "view app details" and click on "Update".
All clicks to update this application will be:
"settings" icon on the top right of the Jira UI -> marketplace apps -> manage apps -> take me there -> connected apps -> Metrics and Reports for Jira Service Management -> view app details -> UPDATE
How are authorization and security?
- Users can view reports only for Jira work items they are authorized to access. As a result, reports generated by different Jira agents may vary even when the same JQL query is used.
- After installating this application, the application will be accessible from all JSM projects within your Jira instance. While the application can be opened from any JSM project, reports can still include work items from other JSM projects as well. This design provides the flexibility to manage reporting from a centralized location. If you want to generate reports for a specific JSM project only, you can restrict the scope using JQL with
project = Your Project Name.
What if I dont have capability to manage Jira in house?
Solverox provides consultancy on Jira, calendars, SLAs, Automations or other subjects that you may need to get the maximum benefit from the applications that Solverox builds. Please contact us at sales [at] solverox [dot] com
What is your pricing policy?
This application is currently available free of charge, but we plan to transition to a paid model in the future. When this happens, we will have clear communication on the pricing policy and grace period for the existing users.
Open Source Credits
Metrics and Reports (JSM) is built using incredible open-source software. We are grateful to the following projects:
- React (MIT License) - UI Framework
Full license notices for these components are available in their respective public repositories and documentation.
How do I contact support?
Please reach us at support [at] solverox [dot] com.
What is your official web page? Where are the legal documents?
Please visit us at solverox.com
Contact
Need more info or have feedback? Please e-mail us at support [at] solverox [dot] com